Technical analysis is a method of evaluating securities by analyzing statistics generated by market activity, such as past prices and volume. Technical analysts believe that the collective actions of all the participants in the market, such as buyers and sellers, are reflected in the price movements of a security and that historical price and volume data can be used to predict future price movements.
In the context of cryptocurrency trading, technical analysis can be used to identify patterns and trends in the market that can be used to make informed trading decisions. There are several technical indicators and charting tools that traders can use to analyze the market, such as:
- Moving Averages (MA): A moving average is a line that is plotted on a chart to show the average price of a cryptocurrency over a specific period of time. Traders use moving averages to identify trends and to determine the strength of a trend.
- Relative Strength Index (RSI): The RSI is a momentum indicator that compares the magnitude of recent gains to recent losses in order to determine overbought and oversold conditions.
- Bollinger Bands: Bollinger Bands are volatility indicators that consist of a moving average and two standard deviation lines. These bands are used to identify potential buy and sell opportunities.
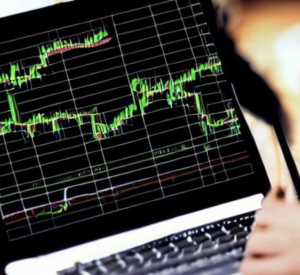
- Candlestick charts: Candlestick charts are a type of chart that is used to represent the price movements of a cryptocurrency over a specific period of time. Candlesticks can be used to identify patterns in the market such as bullish or bearish trends.
- Fibonacci retracement: Fibonacci retracement is a technical analysis tool that uses horizontal lines to indicate areas where the price may experience support or resistance.
It’s important to note that technical analysis is not a foolproof method, and it should be used in conjunction with other forms of analysis such as fundamental analysis and market sentiment. Additionally, the cryptocurrency market is highly volatile and new, so it’s important to be aware of the risks and to conduct your own research.
In conclusion, technical analysis is a method of evaluating securities by analyzing statistics generated by market activity and it can be used in cryptocurrency trading to identify patterns and trends in the market. Traders can use different technical indicators and charting tools such as moving averages, RSI, Bollinger Bands, cand stick charts, and Fibonacci retracement to make informed trading decisions. However, it’s important to use technical analysis in conjunction with other forms of analysis and to be aware of the risks in the highly volatile cryptocurrency market.
Be First to Comment